SYSTEM MONITORING PROCESSOR AND SYSTEM TEMPERATURE SOFTWARE
![]()
|
|
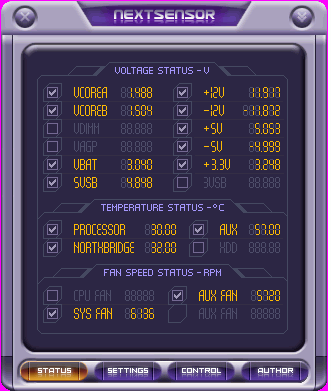 |
||||||||||||||||||||||||||
| Posted:2007-07-16 By computer news Number of View:105558 |
|||||||||||||||||||||||||||
By :computer news Posted:2007-07-16
A computer is a complex machine which asks for a minimum maintenance. A fan which for some reason rotate at lower rate, a heating up processor , hard disk boiling with risk of data losses are common for today computer. To avoid such problem, user has to monitor its computer temperature : using software which give access to multiple information giving notice before possible problem. Monitoring, why and how?First , what is monitoring? we could define it as the evaluation values which move in the course of time and which characterizes certain computer components operation . Here is an example of fan able to tell about its current rotation rate.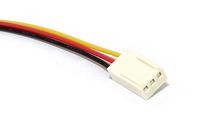 This type of connector transmits to the motherboard the number of its RPM (rotation per minutes)
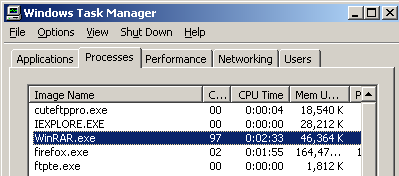
Many software help in the monitoring task, including Windows tools . For example Windows tasks manager , show the current processor load , then you can see if some program is eating a lot of resource . System running fine System overloaded with some application causing overall slow down
Reason for the system slow down : In this case winrar as u see witch was archiving large data The same monitoring can be done for the memory usage ,network ....... the principle task is to optimize operation for user , detect and solve quickly any possible problem. Of course temperatures is another element to be counted in , as well as the fan speed ... Motherboards manufacturers solutionsAsusFor Asus, we finds the applications Asus Probe II and Asus AI Suite. The first one show the supply voltages (3, 5 and 12V), processor and motherboard temperature as well as fan rotation speed. Asus Probe II show warnings written and/or sound according to your choice as soon as :
AI Suite takes again the data of Asus Probe II, adding the processor frequency , FSB and the distributed load between core (in can of multi core processor). Note that if Asus Probe is a small application intended only for monitoring, AI Suite is more advanced application with overclocking capability. 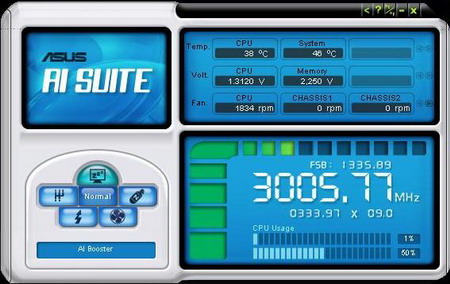
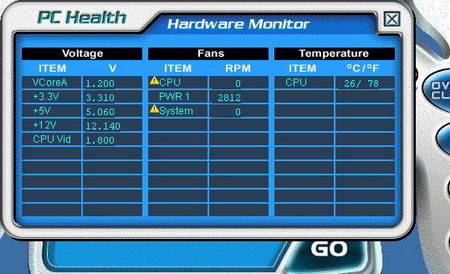
Asus Probe II and Asus AI Suite. GigabyteGigabyte propose another software called Easy Vtune 5, it is necessary for us to move directly to PC Health section located in bottom , in order to avoid many overclocking options and to reach the place witch interests us (Hardware Monitor). Here, you will be able to find the voltage values , the fan speed as well as the processor (and more precisely that external temperatures sensor) and the motherboard temperatures . There is a possibility to control critical points for these parameters above which an alarm will start (using any custom made sound file * .wav or * .mid).
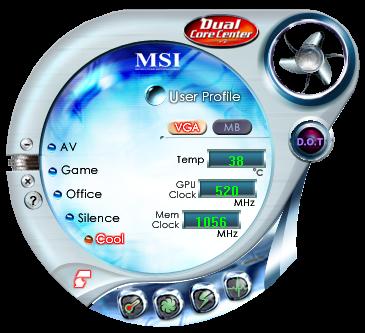
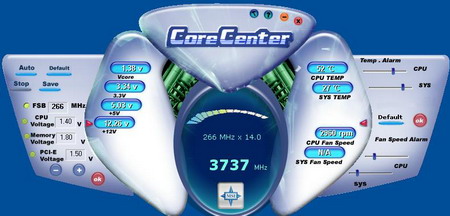
MSIMSI, with its Dual Core Center, allows in theory, to monitor at the same time the motherboard and the graphics card . In practice, we could not find a version of this utility which allow us to execute both at the same time. Monitoring is here (as in the majority of tools distributed by other manufacturers) strongly related to overclocking. but we still have some interesting information:
MSI Dual Core Center and Core Center NVIDIANVIDIA, on its side, developed NTune for nForce motherboards , and in our today review we are interested particularly in NVmonitor. NVmonitor offers a very comfortable health status information : CPU load , memory and hard disks, GPU and processor clock frequency , FSB, memory frequency , various voltage, Fans speeds and CPU , motherboard temperatures . Let us note that Nvidia NVmonitor do not show the current hard disk temperatures but they did not forget about SMART information , and warn alarms in case of CPU or GPU overheating .
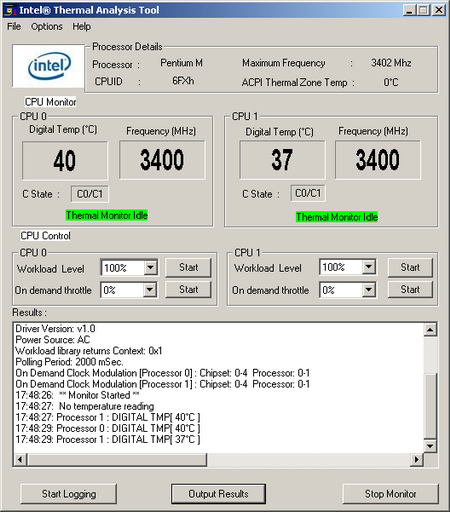
INTELINTEL finally developed for its motherboard a software called : Desktop Control Center, and for its processors Core Duo, Core 2 Duo and Core 2 Quad, famous Thermal Analysis Tool, or TAT . This application provide the internal processor temperature from various core in an independent way. It also specifies their frequencies without being concerned with possible multiplier changes . TAT also allow to stimulate the highest load in one or more core, with an adjustable percentage for each one , and then user can observe the rise in corresponding temperature. This is useful if we wants to know the maximum processor temperature . 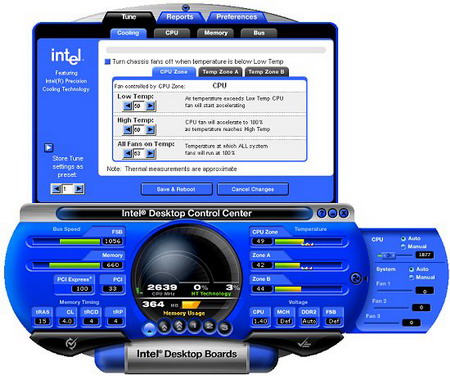
INTEL Desktop Control Center and Thermal Analysis Tool: effective tools Graphics manufacturers solutions :
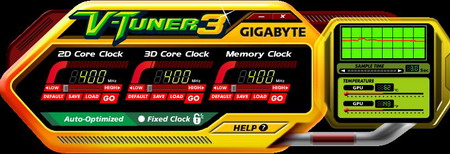
GigabyteGigabyte and its V-Tuner 3 allow certainly to overclock the graphics card but also show the temperature sensor results . The value given can be shown in degree Celsius or Fahrenheit and a small graph informs users about the variation of this value in the course of time (useful to know how temperature rise after launching a game for example).
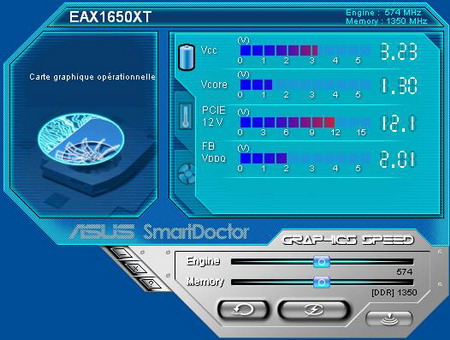
AsusFor Asus, present SmartDoctor which is used at the same time for overclocking and monitoring. :
Note that the monitoring part of this software is accessible only for certain graphics card , in our tests GeForce 7600GS or Radeon X1600XT are deprived from it . But the overclocking module remains always available.
A known and recognized software: SpeedfanPresentation The famous software Speedfan, which is developed by Alfredo Milani-Comparetti (who began his work in 2000), is a software with the multiple functionalities: The famous software Speedfan, which is developed by Alfredo Milani-Comparetti (who began his work in 2000), is a software with the multiple functionalities:
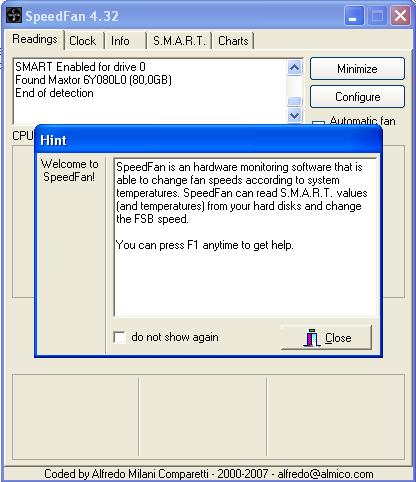
InstallationYou can download the last Speedfan version here . The current version is SpeedFan 4.32 and can be directly downloaded from our site. After a quick install process u will obtain this screen:
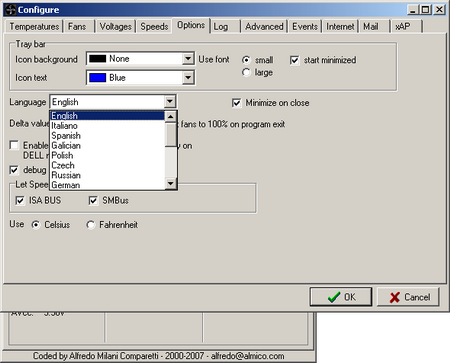
Click on configure TAB to translate all in your preferred language.
Once all small adjustment are done we ave 5 tabs:
Thus in the Readings tab , you can obtain something like that:
Configuration
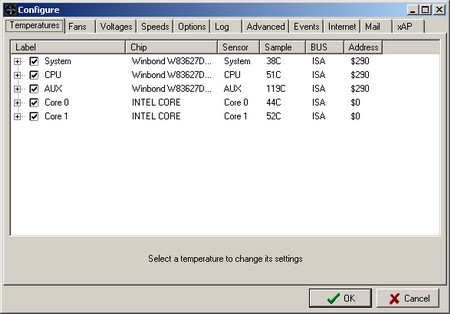
The tab fan, Voltages are respectively used for selecting fan and voltage which you wish to see in the reading window . Just like the temperatures tab , you can remove the values which are not useful . The tab speeds allow to choose the number of fan rotation which can be adjusted by Speedfan, and in bottom of this window, you will be able to define the limiting values used by the software for the fan speed , in order to control the noise and temperature (attention, certain fan could stop if you set too low rotation speed !). Once configured, information appears more clearly in the window of reading
events windows with large functionality
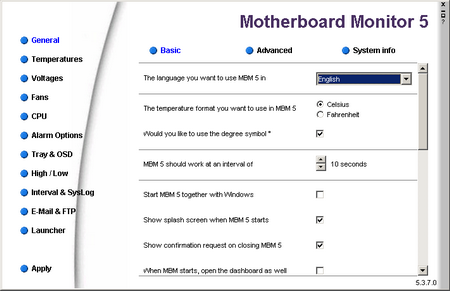
This type of functionalities is particularly powerful for the administration of several computer . Other powerful Monitoring softwareMotherboard MonitorThis software, known under the name MBM, is a must in term of monitoring. Unfortunately the development of this very good software was stopped in June 2004� So the correct operation of this program is strongly related to the recognition of sensor or processor. Here is some functionalities from MBM :
Programs functioning with MBM
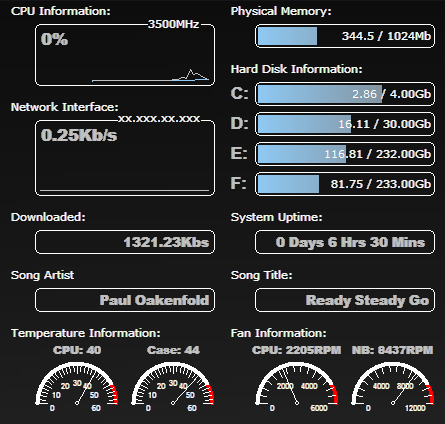
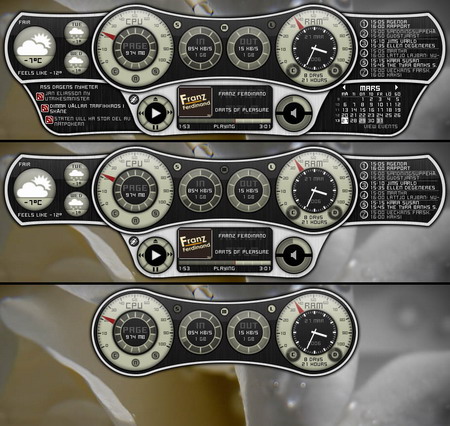
SamurizeSamurize, just like Coolmon or Sysmetrix, this software in a very flexible way show a large number of information. However, the great advantage of Samurize compared to its competitors is its facility to recover information from sensors , either by Motherboard Monitor, or by Speedfan (and even by Everest). The principle of configuration is enough complexes, but progressively becomes increasingly simple with creation . However, even if Samurize is probably the best monitoring software , do not hope to obtain a splendid monitoring in a few minutes; you will have to spend time, but the result is often good . The possibilities are pretty large , especially on the sensor level and the capacity to include images in the interface is an extremely pleasant .
Other temperature monitoring ways
The data brought are complete:
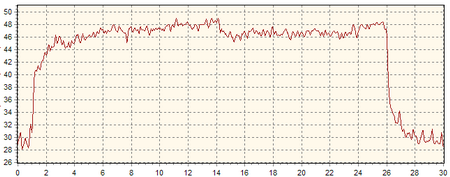
Temperature Monitoring for overclocker
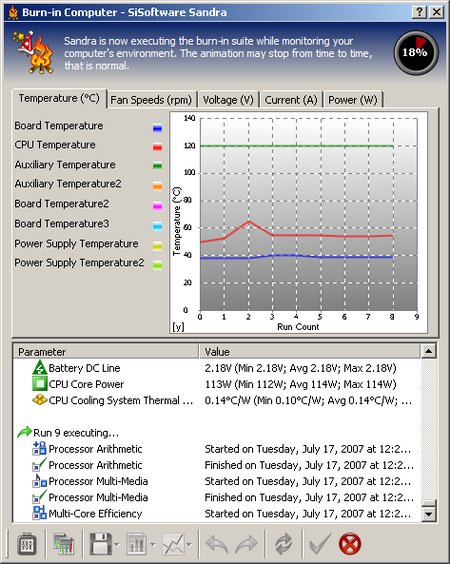
OCCT, perfect software to test computer stability with temperature and voltage monitoring
Conclusion
Some applications of monitoring any type
we would be happy to answer for your question . if you have suggestion or comment
regarding this review our support would be glad to help just join our forum and ask u will get the best answer
to discuss check our forum section :-) RATE THIS REVIEW | |||||||||||||||||||||||||||
![]()

System monitoring processor and system temperature software
System monitoring processor and system temperature software


7600gt review
7600gt is the middle card range.
We already benchmarked this video card and found that ...

 geforce 8800gtx and 8800gts
  Xtreview software download Section
  AMD TURION 64 X2 REVIEW
  INTEL PENTIUM D 920 , INTEL PENTIUM D 930
  6800XT REVIEW
  computer hardware REVIEW
  INTEL CONROE CORE DUO 2 REVIEW VS AMD AM2
  INTEL PENTIUM D 805 INTEL D805
  Free desktop wallpaper
  online fighting game
  Xtreview price comparison center

- The new version of GPU-Z finally kills the belief in the miracle of Vega transformation
- The motherboard manufacturer confirms the characteristics of the processors Coffee Lake
- We are looking for copper coolers on NVIDIA Volta computing accelerators
- Unofficially about Intels plans to release 300-series chipset
- The Japanese representation of AMD offered monetary compensation to the first buyers of Ryzen Threadripper
- This year will not be released more than 45 million motherboards
- TSMC denies the presentation of charges from the antimonopoly authorities
- Radeon RX Vega 64 at frequencies 1802-1000 MHz updated the record GPUPI 1B
- AMD itself would like to believe that mobile processors Ryzen have already been released
- AMD Vega 20 will find application in accelerating computations
- Pre-orders for new iPhone start next week
- Radeon RX Vega 57, 58 and 59: the wonders of transformation
- ASML starts commercial delivery of EUV-scanners
- The older Skylake processors with a free multiplier are removed from production
- Meizu will release Android-smartphone based on Helio P40
- AMD Bristol Ridge processors are also available in American retail
- The fate of Toshiba Memory can be solved to the next environment
- duo GeForce GTX 1080 Ti in GPUPI 1B at frequencies of 2480-10320 MHz
- New Kentsfield overclocking record up to 5204 MHz
- Lenovo released Android-smartphone K8


computer news computer parts review Old Forum Downloads New Forum Login Join Articles terms Hardware blog Sitemap Get Freebies

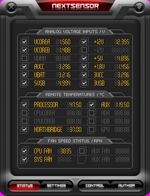
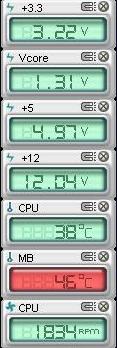

 Among those software, We finds in particular